ETH Increases Toward $3.5K, Erases Much of Earlier Losses (Ethereum Price Analysis)
After a bearish correction phase, the price has now reached a crucial support zone, defined by the 100-day moving average and the 0.5-0.618 Fibonacci levels.
Given the strong demand at this juncture, a mid-term bullish rebound is looking likely.
Technical Analysis
By Shayan
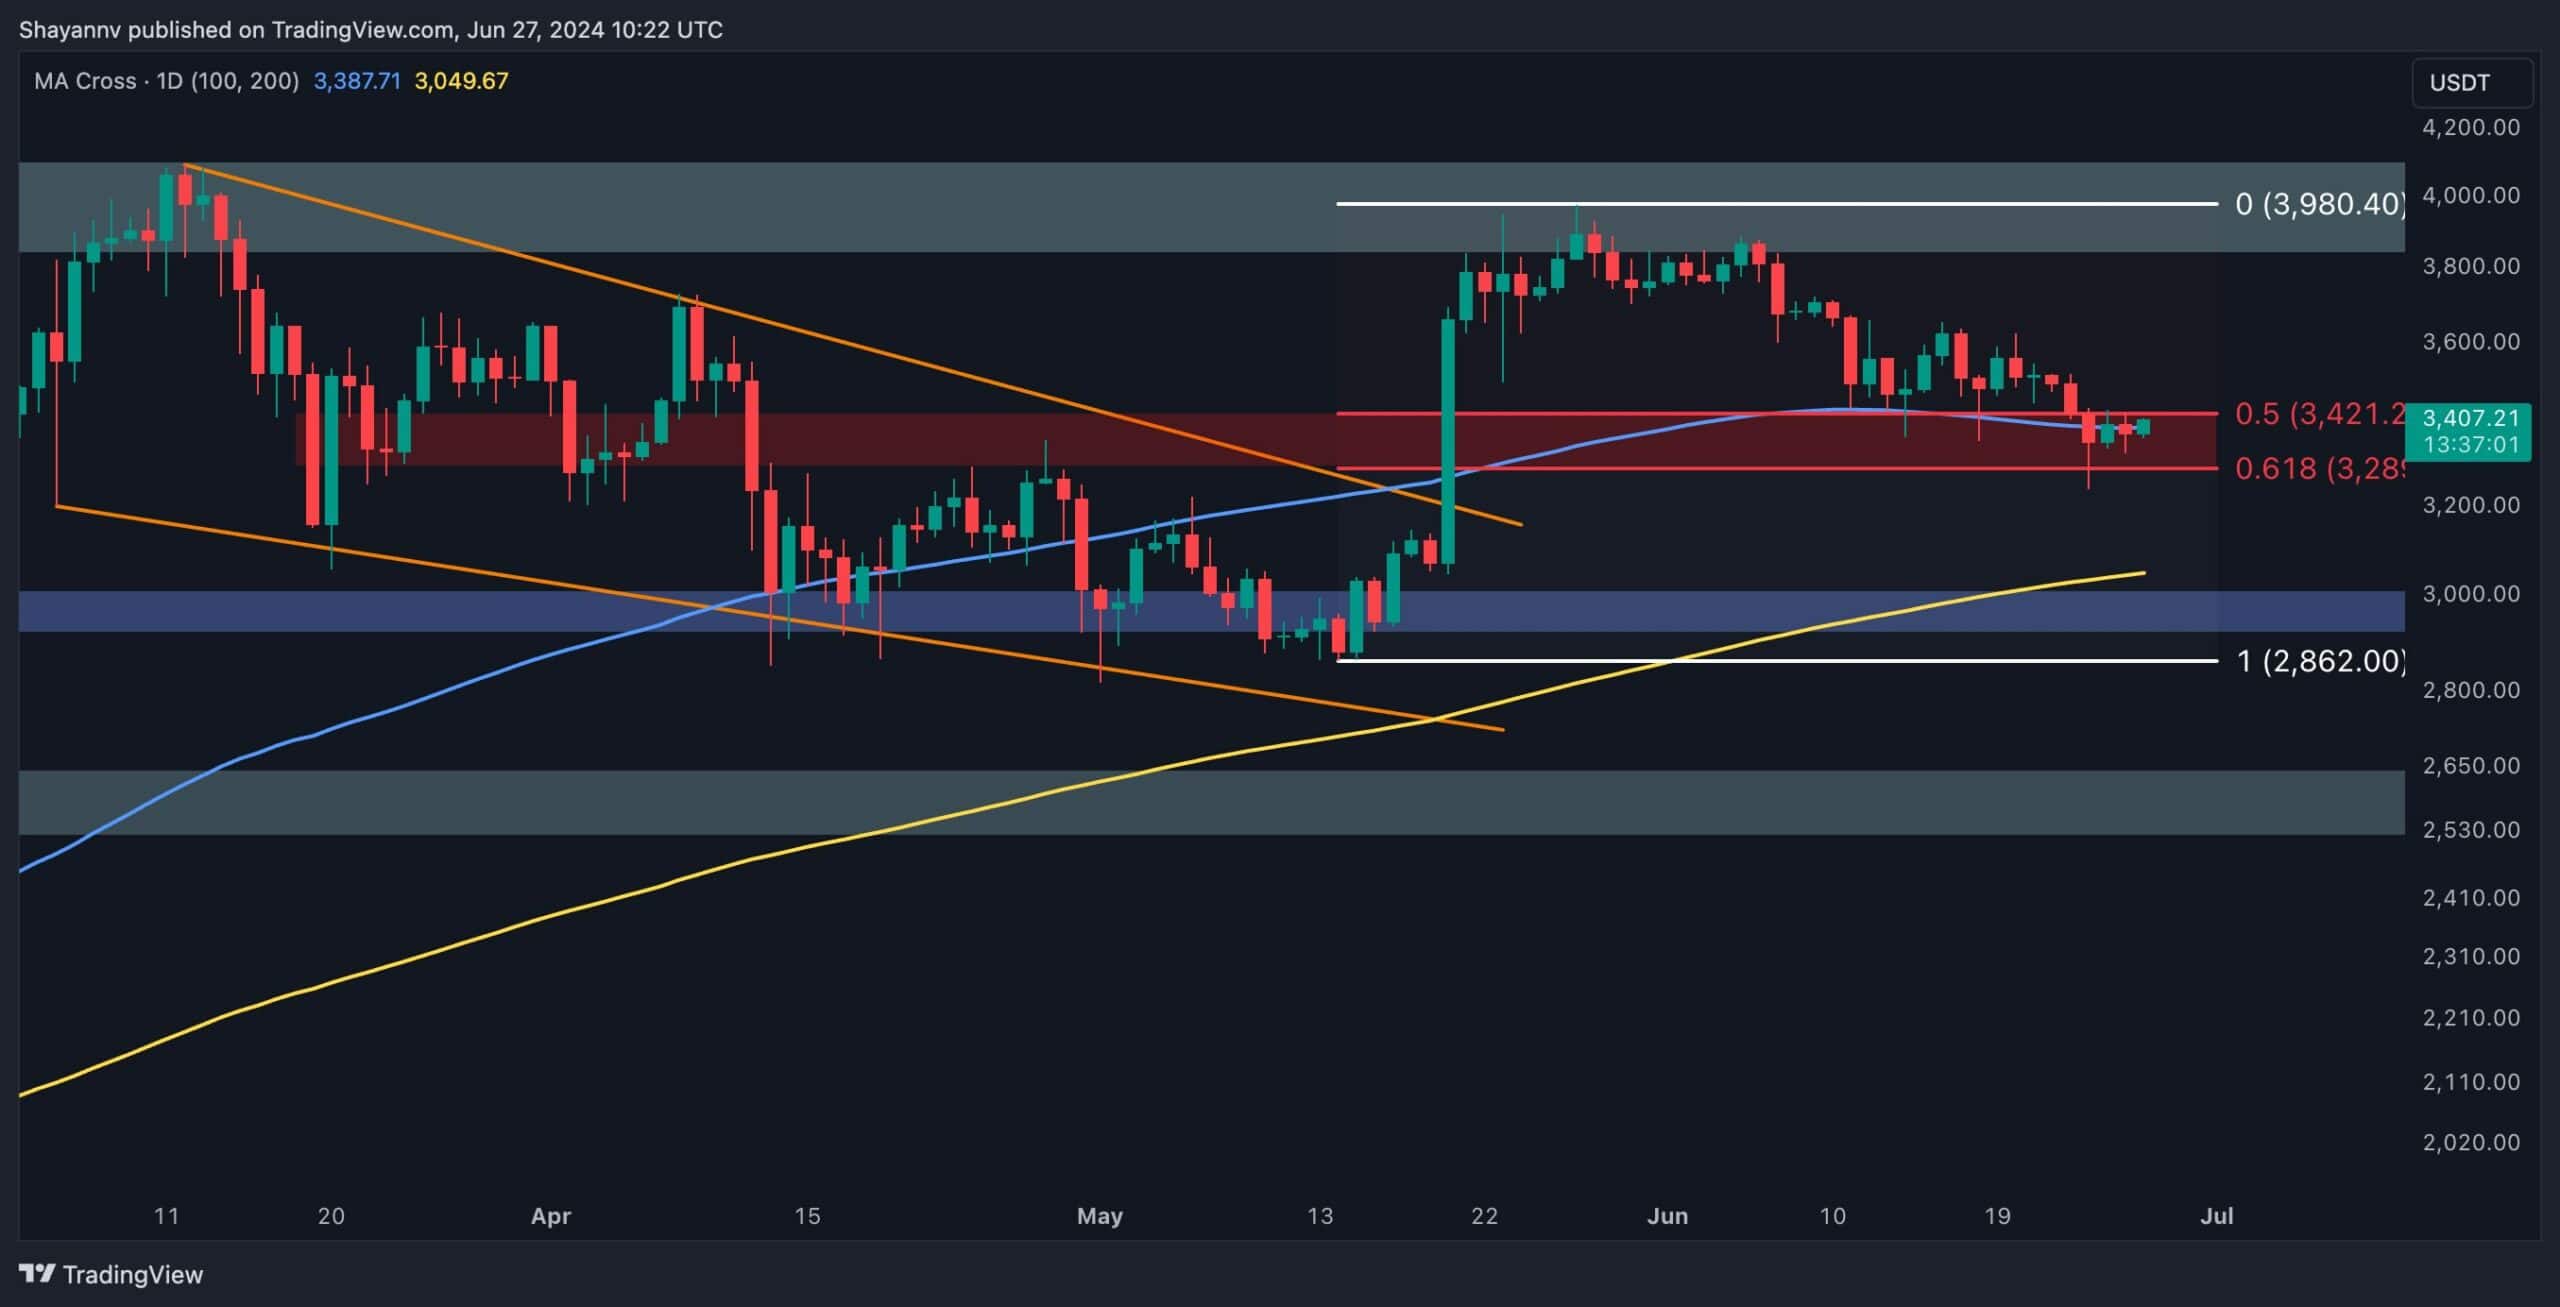
The Daily Chart
A detailed examination of the daily chart reveals that Ethereum has entered a significant support zone following a corrective pullback. This zone spans the price range between the 0.5 ($3421) and 0.618 ($3289) Fibonacci levels, coinciding with the critical support of the 100-day moving average ($3387).
This area is poised with potential demand, where market participants might be inclined to open long positions.
Considering these factors, an increase in demand is expected, leading to a mid-term bullish reversal targeting the $4K resistance. However, if the price drops below this support, the next significant defense line for buyers will be the 200-day moving average.
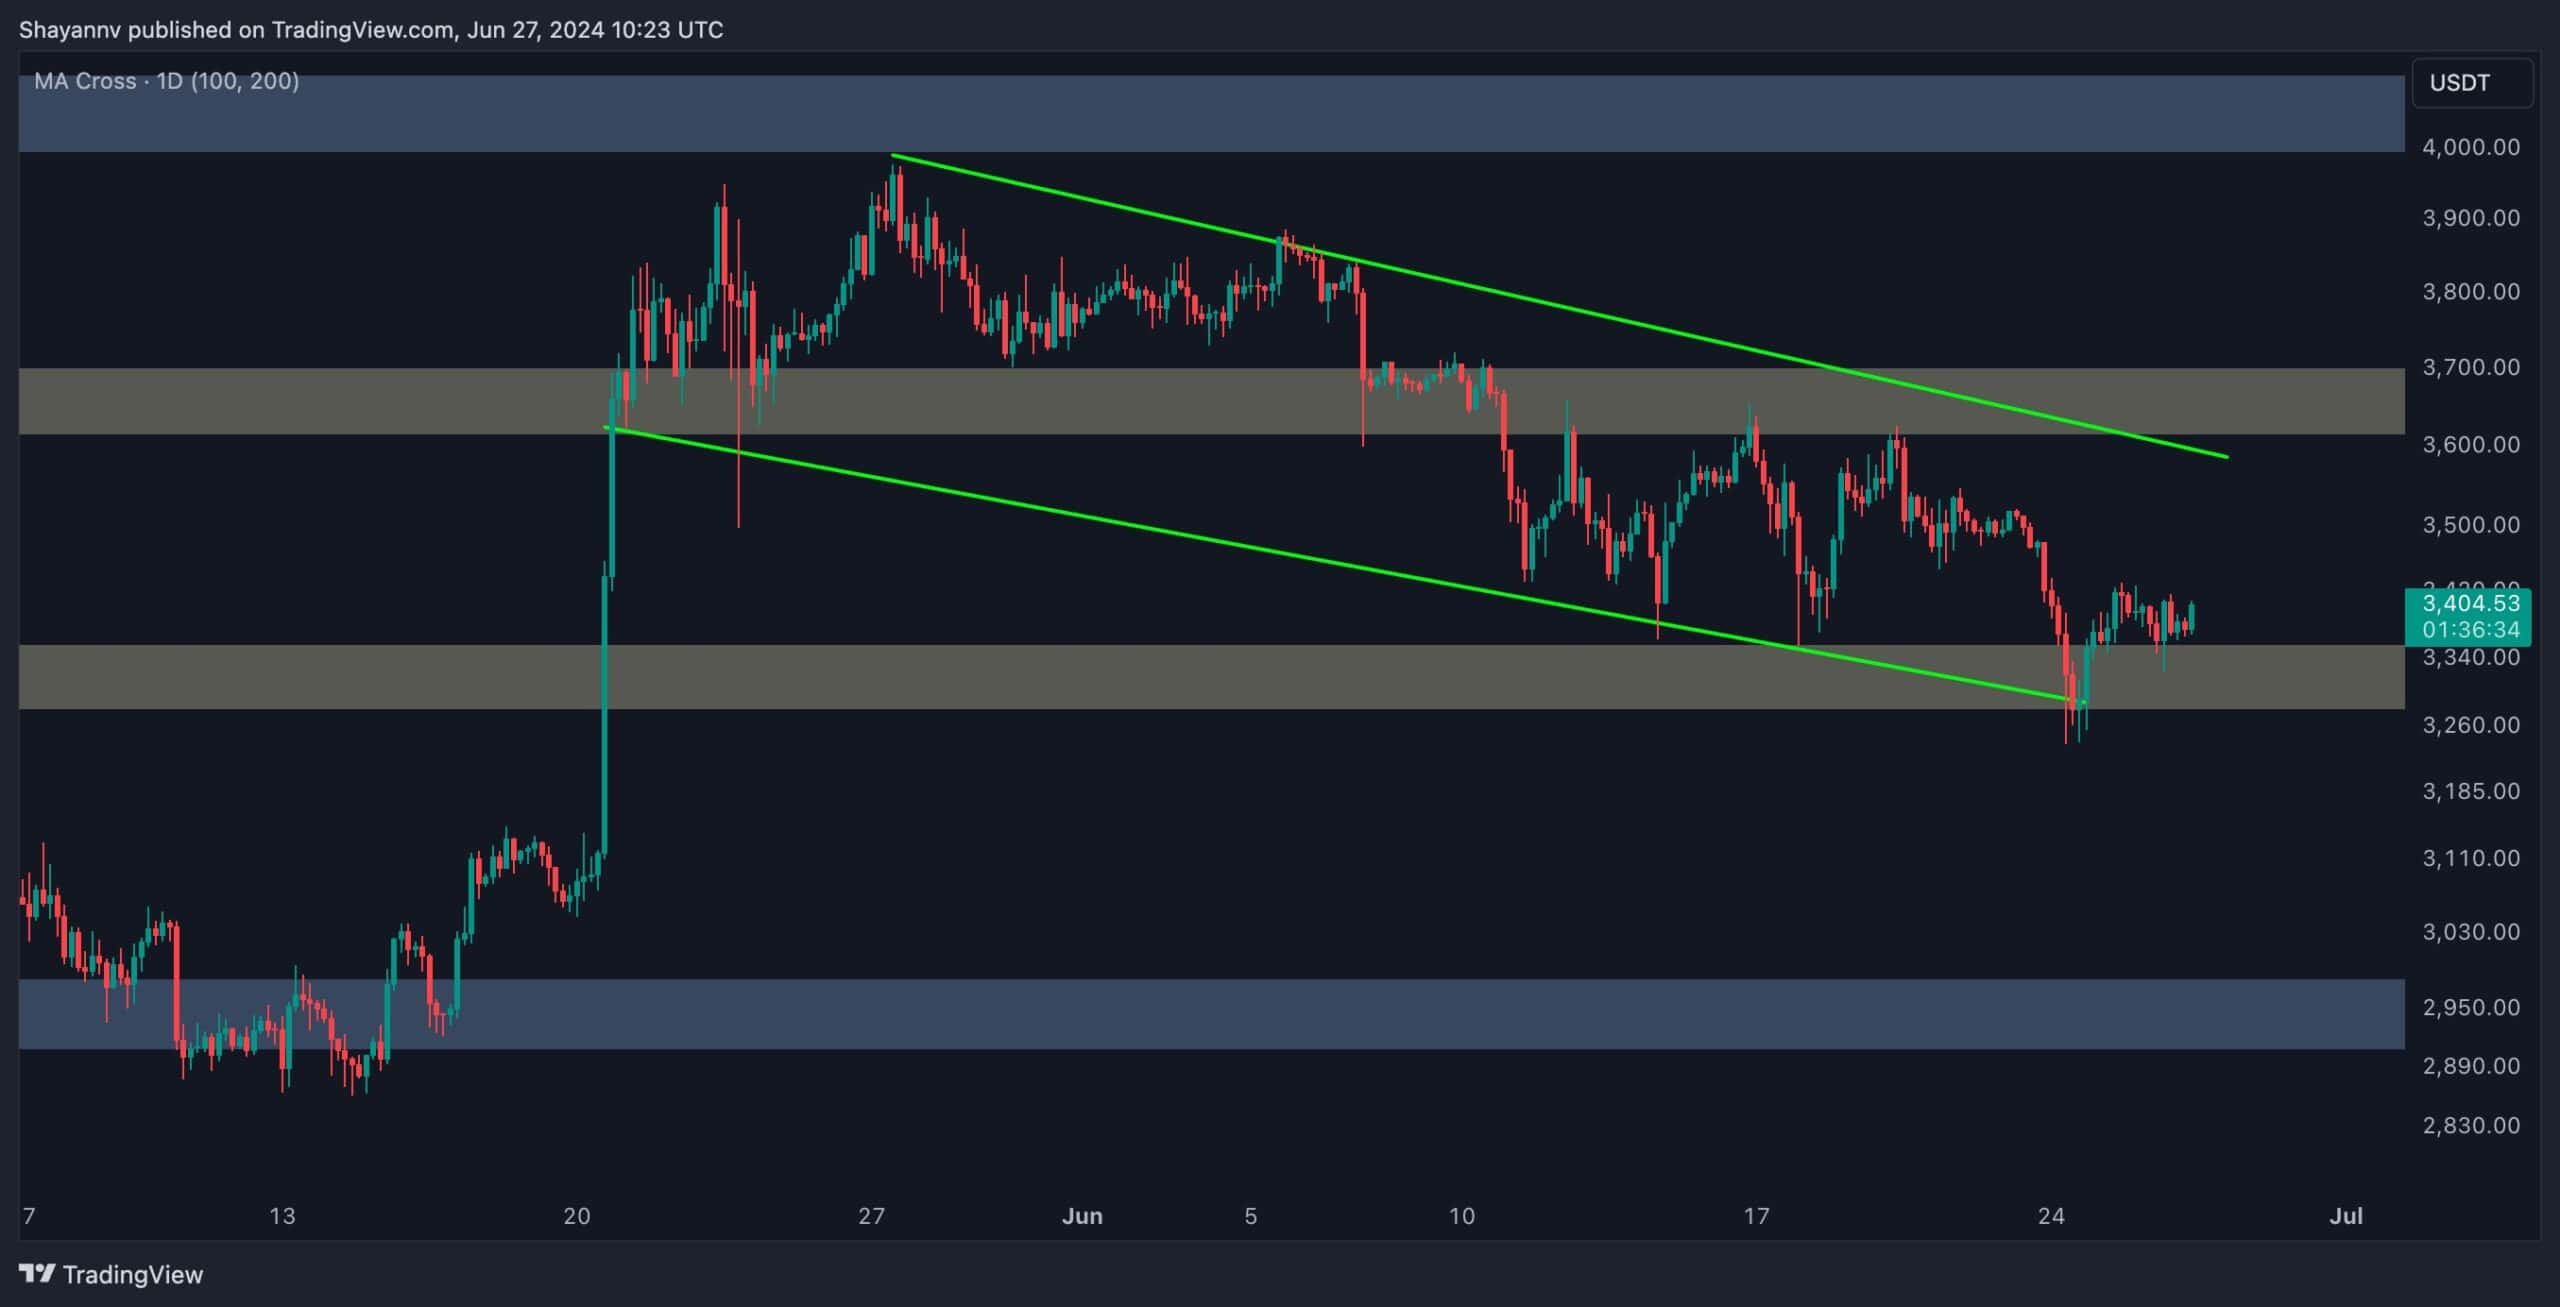
The 4-Hour Chart
The 4-hour chart clearly shows Ethereum’s recent corrective move, with the price forming a bullish continuation flag pattern.
If the price breaks out from the upper boundary of this pattern, it signals a potential continuation of the bullish trend. Currently, the cryptocurrency is near the lower boundary of this flag, aligning with the critical support of around $3.3K.
If buyers re-enter the market and demand rises, the price is expected to break above the flag’s upper boundary at $3.6K, leading to a strong uptrend towards the $4K resistance.
Conversely, if sellers push the price below the $3.3K support, a drop toward the substantial $2.9K support will likely follow. In the mid-term, the price is expected to remain within the $3.3K-$3.6K range until a breakout occurs.
Sentiment Analysis
By Shayan
While Ethereum currently rests in a critical support region with significant potential demand, analyzing the future market sentiment is essential for forecasting its next moves.
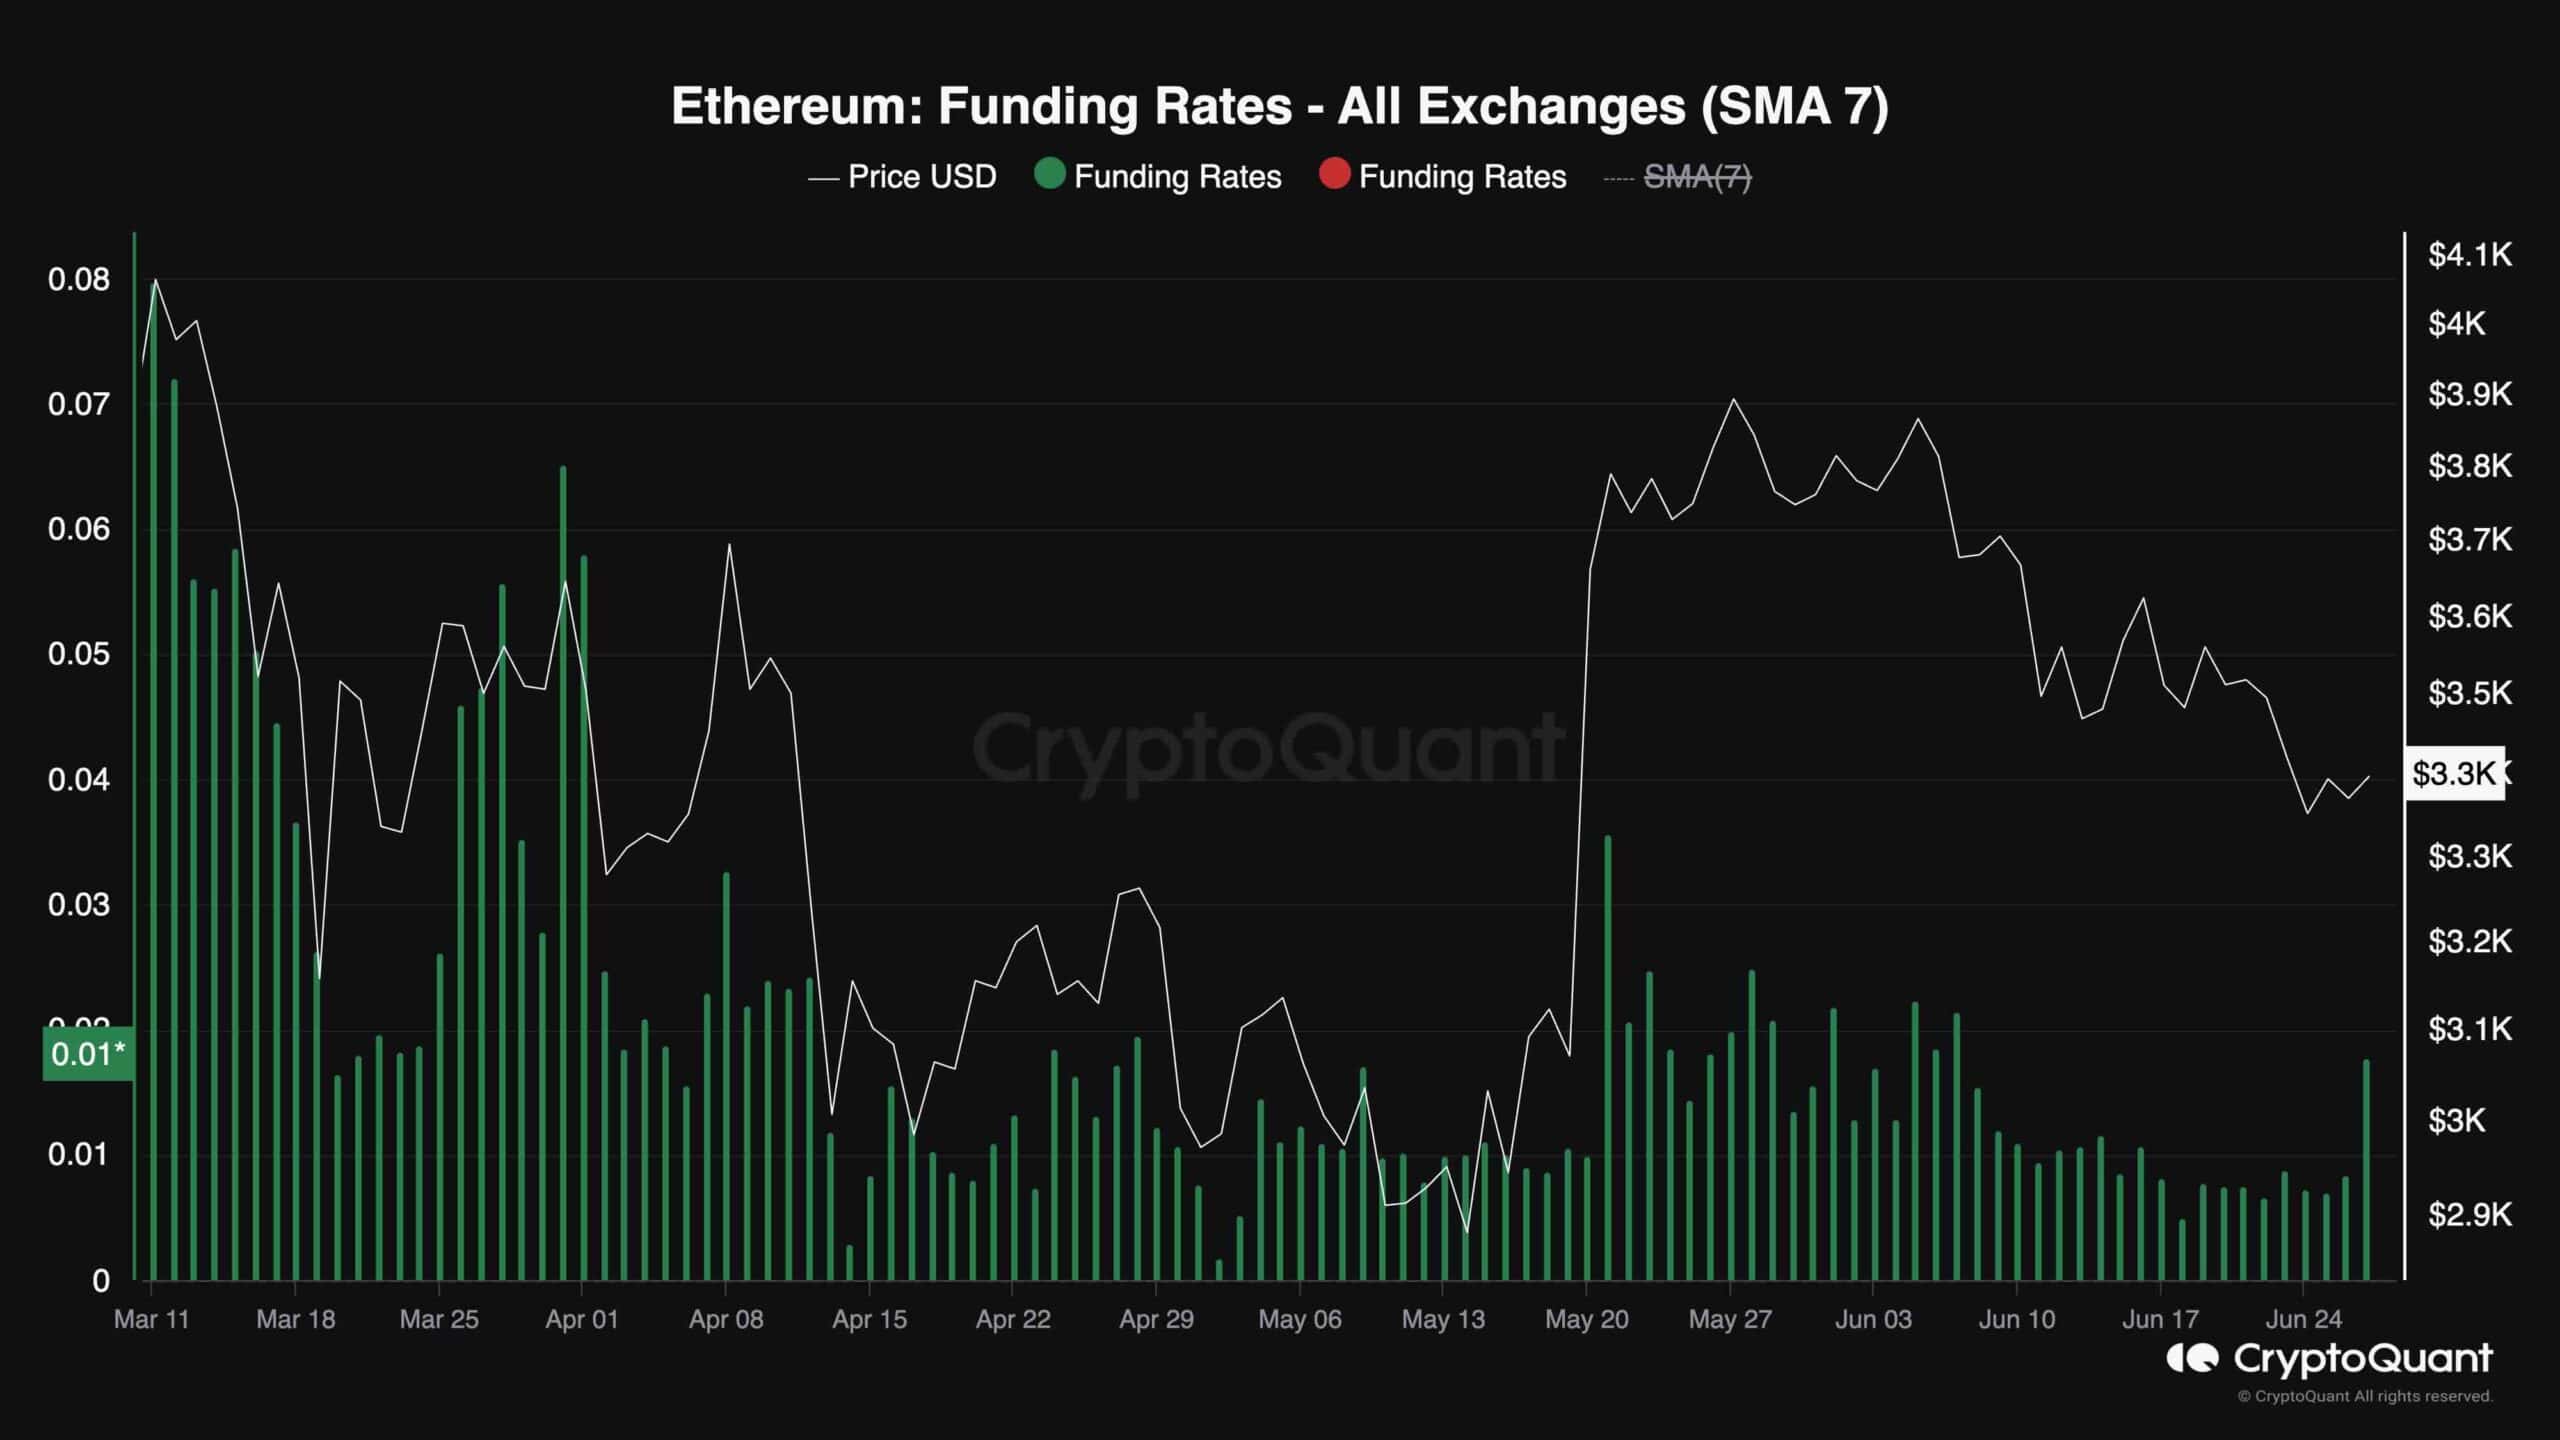
The following chart highlights the Ethereum funding rate metric, which indicates whether buyers or sellers are executing orders more aggressively. Positive funding rates suggest bullish sentiment, whereas negative rates imply bearish sentiment.
The funding rate metric recently showed a notable increase after a period of slight declines, which coincided with a corrective phase in Ethereum’s price.
This uptick suggests that demand is present near the crucial support level of $3.3K, potentially halting further downward pressure and initiating a bullish reversal. If the funding rate metric continues its upward trend, it indicates that the futures market sentiment is turning bullish, making a mid-term bullish reversal more likely.
The post ETH Increases Toward $3.5K, Erases Much of Earlier Losses (Ethereum Price Analysis) appeared first on CryptoPotato.