Ethereum ETF Approval Imminent: Experts Predict July 4th Timeline

- Bloomberg’s senior ETF analyst Eric Balchunas predicts a potential approval timeline for spot Ethereum ETF at around July 4, 2024.
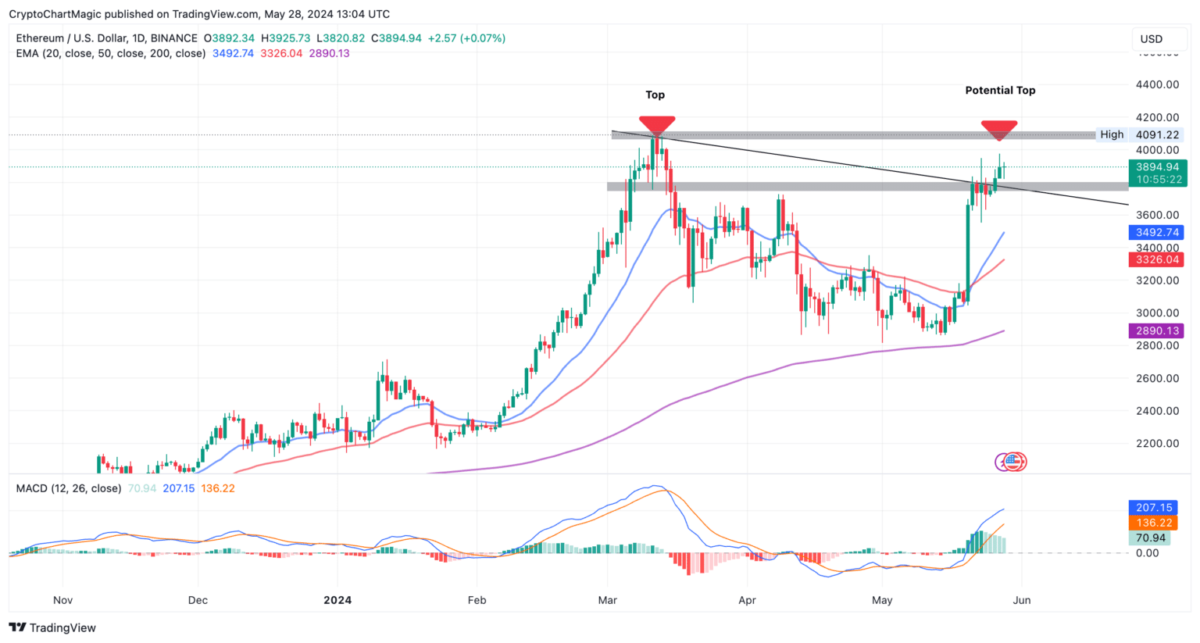
- The Ethereum price chart forms a golden cross suggesting a likely move above $4,000. Above $4,000, FOMO could lead to a new all-time high at $5,000.
The potential approval of Spot Ethereum ETFs has become a hot topic in the crypto community, with industry experts weighing in on the timing of the U.S. Securities and Exchange Commission (SEC)’s decision. Nate Geraci, host of the ETF Prime podcast, recently shared his insights, suggesting that the S-1 approvals could come within a few weeks.
In a post on X, Geraci stated, “When will SEC approve spot eth ETF registration statements? Nobody knows for sure, but my expectation would be next few weeks. 2-3 months max.” He also noted that the approval process for Spot Ethereum ETFs could be expedited due to the swift approval of Bitcoin ETFs previously.
Additionally, he argued that the SEC has already done much of the “heavy lifting” with the approval of Spot Bitcoin ETFs and Ethereum futures ETFs, suggesting it might now be “a matter of how long SEC wants to string this out.”
Meanwhile, Eric Balchunas, a senior ETF analyst at Bloomberg, responded to Geraci’s post by proposing a potential Ether ETF S-1 approval timeline around July 4, 2024. Balchunas commented, “July 4th feels like a good over/under.” Geraci agreed, adding, “I like it… I’ll take under, but right timeframe IMO.”
Thus, it can be inferred that the S-1 approvals could take more than a month. While the approval might not be as swift as it was for Bitcoin ETFs, it is still relatively early considering the ongoing debate around Ethereum’s status and other regulatory implications. Therefore, the chances of Spot Ethereum ETF trading commencing in the coming month remain low.
ETH Price Action Ahead
Ethereum’s price prediction shows Ether maintaining its position above critical support levels on the daily chart, specifically between $3,600 and $3,800. The Moving Average Convergence Divergence (MACD) indicator supports a bullish outlook, enhancing the likelihood of a move above $4,000.
A recently confirmed golden cross, where the 20-day Exponential Moving Average (EMA) crossed above the 50-day EMA, further signals a bullish trend, making ETH a promising buy.
Some investors are likely waiting on the sidelines for additional confirmation of a breakout. A daily close above $3,900 would support the uptrend and confirm the bulls’ strong market presence.
A further rise above $4,000 could trigger FOMO (fear of missing out) among investors, potentially driving prices to a new high above $5,000.
However, a potential double-top pattern near $4,100 could cause ETH’s price to fall below $4,000. If this level is breached successfully, a significant rally targeting $5,000 may follow.
